

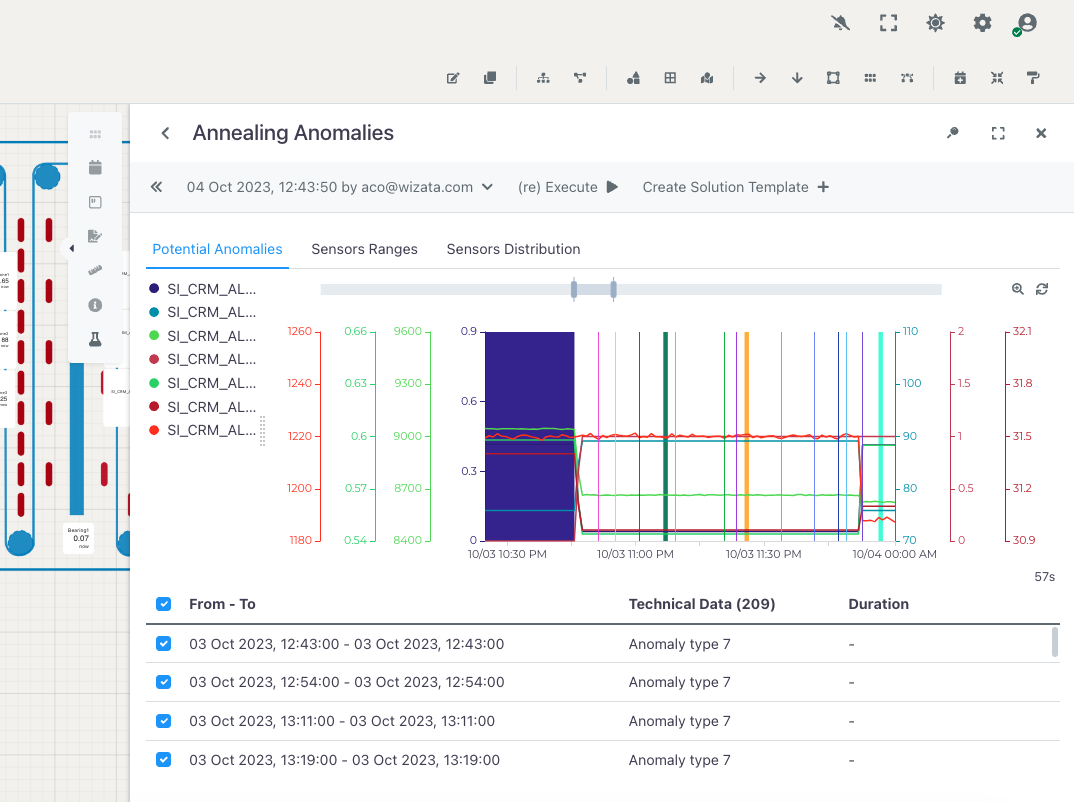
A kiln that draws 8% more power, a reactor whose temperature variance widens, or a filler line that starts drifting from target weight rarely announces a major problem. The change often begins inside normal operating ranges, buried in thousands of signals and shifting production conditions. Knowing how to detect process anomalies means identifying those early deviations before they become scrap, energy loss, off-spec product, or unplanned downtime.
For industrial manufacturers, anomaly detection is not simply an exercise in flagging unusual data points. A reading can be statistically unusual and operationally harmless. Another can look normal in isolation while signaling a serious process failure when considered alongside feed quality, production rate, equipment state, recipe, or ambient conditions. The goal is to detect meaningful deviations and give operations teams enough context to act.
Start With a Definition of “Normal”
Every plant has variation. Raw materials change, operators make adjustments, equipment ages, and production schedules shift. An anomaly is not any movement away from a setpoint. It is a deviation that cannot be explained by expected operating conditions or one that creates unacceptable risk to throughput, yield, quality, energy consumption, emissions, or asset health.
That definition needs to be agreed upon by process engineers, operators, maintenance teams, and data specialists. A process engineer may care about a pressure-temperature relationship that predicts conversion loss. Maintenance may be looking for a vibration pattern linked to bearing wear. A plant director may want early warning of the conditions that push energy cost per ton above target.
This is why fixed limits alone are rarely enough. A motor current of 250 amps may be acceptable at one production rate and suspicious at another. A temperature excursion may be normal during grade changes but unacceptable during steady-state production. The baseline has to reflect the operating context.
Build a Trusted Data Foundation First
Most anomaly detection initiatives fail before modeling begins. The issue is not a lack of data. It is that the relevant data is fragmented across historians, PLCs, laboratory systems, maintenance platforms, quality databases, and manual operator records.
Before applying analytics or AI, bring together the signals that describe both process behavior and process context. This usually includes time-series sensor data, equipment status, production rate, recipe or product grade, lab measurements, operator actions, alarm history, and maintenance events. Data must be aligned in time, tagged consistently, and checked for quality issues such as frozen tags, missing values, unit mismatches, and incorrect timestamps.
Context is the difference between noise and insight. Consider a mill where vibration increases during a known startup sequence. Without a run-state signal, a model may generate repeated false alerts. Add the equipment state, material type, and speed, and the same model can separate expected startup behavior from an abnormal mechanical pattern.
A unified industrial data layer makes this work repeatable. Rather than preparing a new dataset for every use case, teams can create governed, reusable data products that support anomaly detection across lines, assets, and sites.
How to Detect Process Anomalies With the Right Method
There is no single detection method that fits every industrial process. The right choice depends on the failure mode, the available history, the frequency of change, and the speed at which operators need to respond. In practice, plants often use several methods together.
Use engineering limits for known risks
Rules and control limits remain valuable where the process physics are understood and the consequences are clear. High-high temperature limits, low lubrication pressure alarms, and quality specifications are essential safeguards. They are transparent, easy to validate, and useful for immediate intervention.
Their limitation is that they detect problems late when a variable has already crossed a threshold. They also struggle with multivariable behavior. A furnace may remain within every individual limit while the relationship between fuel flow, oxygen, draft, and product quality has moved into an inefficient or unstable state.
Look for statistical drift in stable operations
Statistical process control can identify gradual shifts in mean, variability, trends, or distribution. Control charts, rolling averages, and rate-of-change checks are practical ways to spot a process that is becoming less stable even before an absolute limit is breached.
This approach works well for repeatable processes with relatively stable operating windows. It needs careful segmentation, however. Combining data from different recipes, campaigns, or operating modes can create baselines so broad that meaningful deviations disappear.
Apply multivariable and AI-based detection for complex behavior
AI-based anomaly detection is most valuable when process performance depends on many interacting variables. Models can learn expected relationships between inputs and outputs under specific operating conditions, then calculate a deviation score when the observed behavior no longer matches that learned pattern.
For example, an AI model may learn the expected steam consumption of a dryer based on throughput, moisture content, product type, and ambient conditions. If energy use rises beyond the expected range, the model can identify the deviation while accounting for changes that would make a simple threshold misleading.
The strongest models do more than assign a score. They show likely contributing variables, compare the current state with similar historical conditions, and connect the anomaly to an operational decision. A black-box warning that says “unusual behavior detected” will not earn operator trust on a busy shift.
Separate Detection From Diagnosis
Detection answers, “Is something abnormal happening?” Diagnosis asks, “What is driving it, and what should we check first?” These are related but distinct tasks.
An effective workflow ranks anomalies by business impact and then provides the evidence required for investigation. If yield drops, the system should allow engineers to see whether the event coincided with a raw-material shift, abnormal residence time, a control-loop change, declining equipment performance, or a combination of factors.
This requires process knowledge. The best anomaly programs encode known operating modes, equipment dependencies, and cause-and-effect relationships instead of treating every tag as an unrelated column in a dataset. Operators should also be able to label alerts as valid, expected, or irrelevant. That feedback improves the detection logic and prevents alert fatigue.
Put Alerts Into the Operating Routine
An anomaly that sits in a dashboard after the shift has ended creates little value. Detection must be connected to the people and workflows that can respond.
Define who owns each alert category, what response time is appropriate, and what action should follow. A high-impact process anomaly may trigger an operator check, a recommended control adjustment, an engineer review, or a maintenance work order. Lower-priority patterns may be logged for weekly performance analysis.
Avoid sending every deviation to every user. A useful alert contains the affected asset or process area, the severity, the operating context, the variables contributing to the deviation, and a clear next step. It should be delivered through the operational interface teams already use, not buried in a separate analytics environment.
At Wizata, this is the difference between an isolated model and a plant-scale capability: industrial data is contextualized, models are deployed into operations, and teams can manage performance across assets without rebuilding the approach for every new line.
Measure the Value, Not Just the Model Accuracy
A technically accurate anomaly model can still fail commercially if it identifies events that do not change decisions. Measure performance through operational outcomes: avoided downtime, reduced energy per unit, fewer quality deviations, higher yield, faster troubleshooting, or fewer unnecessary maintenance interventions.
Track precision as well. If a system creates ten alerts and only one is actionable, operators will stop using it. Early projects should focus on a high-cost, recurring issue with enough historical data and a clear response path. This produces a credible result, establishes trust, and creates a template for wider deployment.
The trade-off is straightforward. Highly sensitive detection finds more potential problems but can create noise. Tighter detection reduces false positives but may miss early warnings. Tune the system according to the consequence of missing an event, the cost of investigation, and the level of control the plant has over the process.
Scale From One Use Case to a Repeatable Capability
Once a team proves value on one asset or process, the next challenge is scaling without creating a collection of disconnected models. Standardize data definitions, model monitoring, alert governance, and operator feedback loops. Keep local process expertise in the design, because a model that works in one plant may need adjustment for another plant’s raw materials, equipment configuration, or operating practices.
Process anomalies will never disappear from heavy industry. What changes is how quickly the plant can see them, understand them, and intervene. The most valuable systems make deviations visible while there is still time to protect the next ton of production, not merely explain the last one.


